analytics1_1
Technical Analysis of Daily Price Movement of Ethereum Cryptocurrency, Friday May 26, 2023.
Technical Analysis of Daily Price Movement of Ethereum Cryptocurrency, Friday May 26, 2023.
Crypto-currencies
2023-05-26 08:17:54
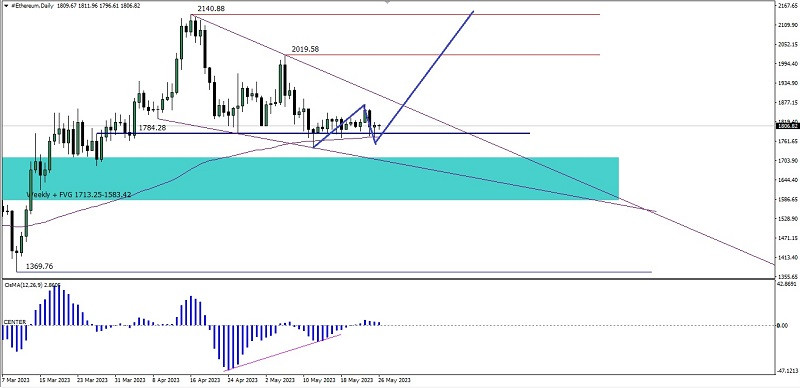
There are several interesting things if we look at the daily chart of the Ethereum cryptocurrency:
1. The emergence of the Bullish Continuation = Failing Wedge pattern.
2. The appearance of hidden deviations between price movements and the osMA indicator.
3. Price movement was again halted at the Bullish Orderblock support level 1784.28 for the umpteenth time.
4. Apart from moving above the EMA 100, the price movement of Ethereum is also stuck at the dynamic 100 level which also happens to intersect with the support level of the Bullish Orderblock.
Based on the four facts above, Ethereum today as long as there is no deeper decline below the 1543.52 level in the near future has the potential to appreciate upwards to break above the 1871.82 level. If this level is successfully broken above, Ethereum will try to test the 2019.58 level as its main target and the level of 2140.88 as the second target.
(Disclaimer)
Смотрите также