Solana spot ETF around corner
Crypto-currencies
2025-06-11 14:23:42
Right now, Solana is in the spotlight for traders. According to the latest reports, the US Securities and Exchange Commission (SEC) has requested that potential Solana ETF issuers submit amended S-1 forms within the next week, increasing the chances for the approval of a spot ETF for this asset.
The agency informed issuers that it would review and comment on the S-1 forms within 30 days of submission. According to two sources, the SEC has asked issuers to update the language regarding the issuance structure and how issuers will handle staking, adding that the agency appears open to including staking as part of the Solana ETF.
These updates could put the Solana ETF on a path toward approval within three to five weeks. The SEC may now prioritize processing 19b-4 filings for Solana and staking ETFs sooner than initially expected. Issuers and industry participants have likely been working with the SEC and its crypto task force to develop guidelines, but final deadlines for agency decisions on such filings are not expected before October.
Cryptocurrency exchange-traded products (ETPs) are regulated funds that give investors access to the spot price of underlying crypto tokens. Multiple issuers are competing for a Solana ETF, including Fidelity, Franklin Templeton, VanEck, Bitwise, Canary Capital, 21Shares, and Grayscale.
In the meantime, the SEC itself has made no official comments.
In any case, the upcoming decision is undoubtedly a major milestone for the crypto industry. Solana, as one of the leading altcoins with a well-established ecosystem and significant market capitalization, has the potential to open the door to broader recognition and institutional adoption. Institutional investors generally prefer to invest through regulated and familiar instruments such as ETFs. The potential approval of a Solana ETF could have far-reaching implications.
First, it could significantly increase Solana's liquidity by attracting new capital and fostering further ecosystem growth. Second, it could legitimize Solana in the eyes of traditional financial institutions, leading to greater interest and investment in other crypto projects. Finally, it may set a precedent for the approval of ETFs for other altcoins, further diversifying the crypto market and increasing its appeal to a broader range of investors.
However, it is important to note that ETF approval does not guarantee success. The cryptocurrency market remains volatile and subject to various factors, including regulatory changes, technological innovations, and macroeconomic conditions. Nevertheless, the SEC's request for amended S-1 filings is clearly a positive signal, indicating that the Commission is considering broader recognition and integration of cryptocurrencies into the traditional financial system.
Trading recommendations
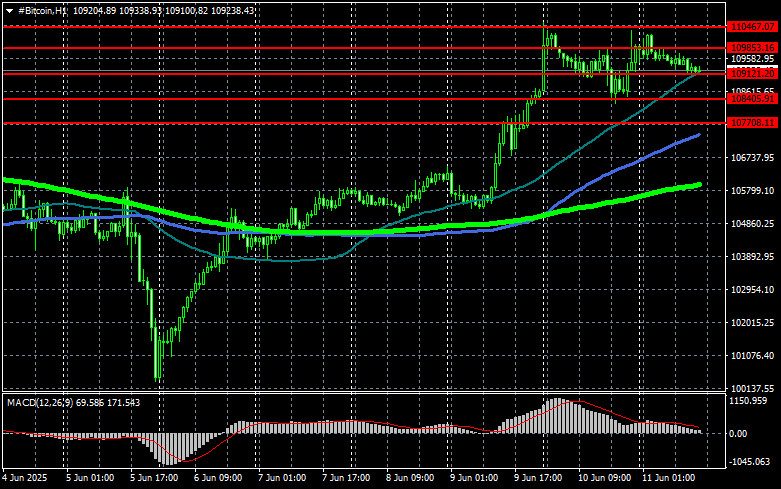
As for Bitcoin's technical outlook, buyers are currently targeting a return to the $109,800 level, which opens the way to $110,500. From there, it's just a quick step to $111,100. The most distant target is the high near $111,900; breaking above it would confirm a strengthening bullish market. In case of a decline, buyers are expected at $109,100. A move below this area could quickly push BTC down to around $108,400. The most distant target would be the $107,700 zone.
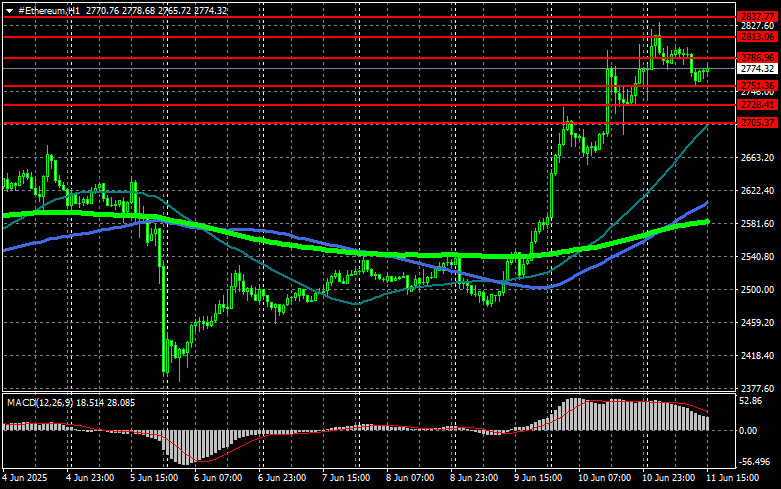
For Ethereum, a clear consolidation above the $2,786 level opens the path to $2,813. The furthest target is the high near $2,837. Breaking above this level would confirm a bullish market structure. If ETH declines, buyers are expected at $2,751. A move below this area could quickly send ETH down to around $2,728. The most distant target would be the $2,705 zone.
What's on the chart
- Red lines represent support and resistance levels, where price is expected to either pause or react sharply.
- Green line shows the 50-day moving average.
- Blue line is the 100-day moving average.
- Lime line is the 200-day moving average.
Price testing or crossing any of these moving averages often either halts movement or injects fresh momentum into the market.
Смотрите также