GBP/USD Forecast for July 11, 2025
Technical analysis
2025-07-11 04:46:25
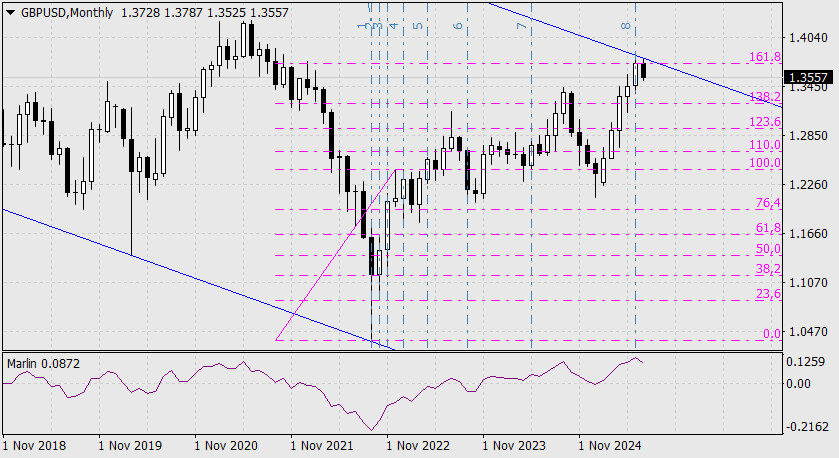
GBP/USD On the monthly chart, the British pound reversed from the 161.8% Fibonacci reaction level, calculated from the upper boundary of the global 18-year price channel, immediately after the 8th Fibonacci time line.
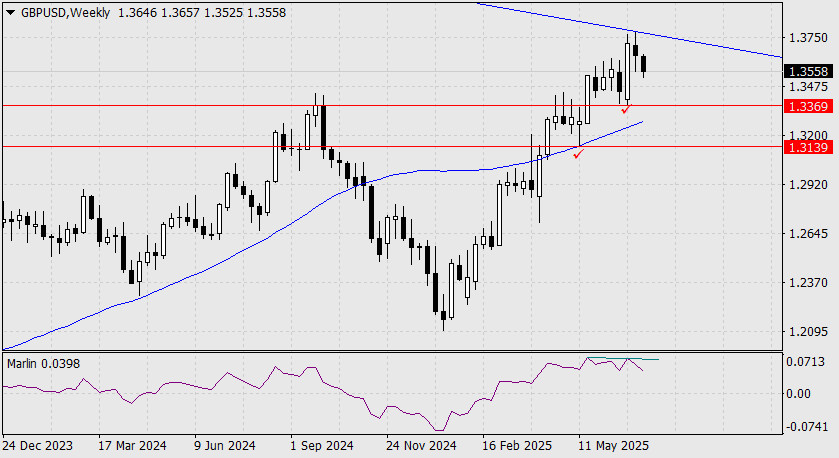
A long-term decline lies ahead for the pound — potentially, and worryingly, toward parity. On the weekly chart, we observe a divergence and two nearby (relative to this timeframe) target levels: 1.3369 and 1.3139.
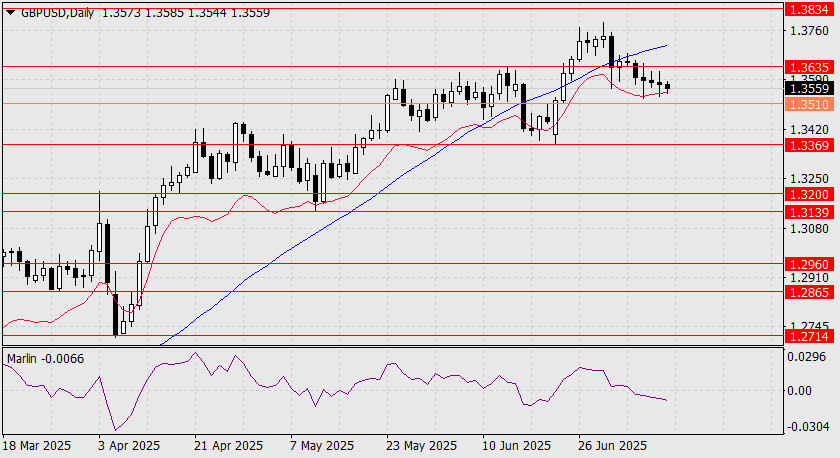
The price remains stable within the 1.3510–1.3635 range and is awaiting signals from external markets for a smooth breakout below the intermediate level of 1.3510. The first target is 1.3369, the low from June 23.
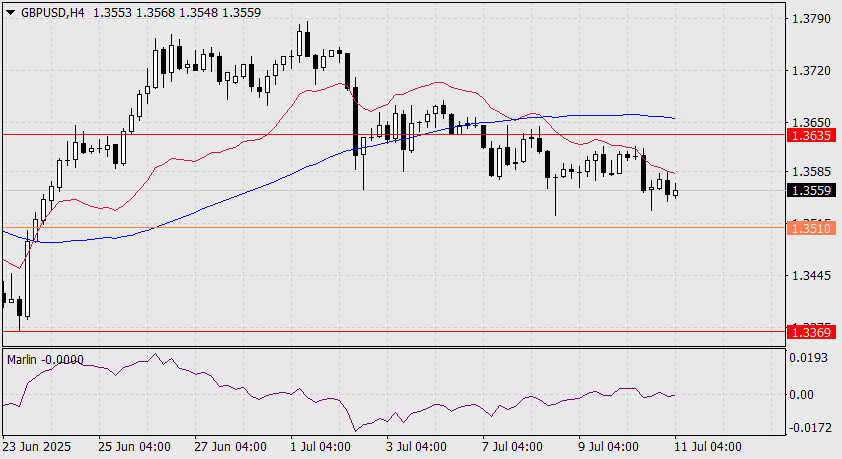
On the H4 chart, the Marlin oscillator is consolidating around the zero line, confirming the current neutral and wait-and-see sentiment. However, the price has been moving below the balance line for an extended period, which also confirms that bears are prepared to resume the downward trend should any fundamental signal emerge.
Смотрите также