GBP/USD. Weekly preview. From ship to ball
Fundamental analysis
2026-01-05 02:09:00
The GBP/USD currency pair traded in both directions on Friday with reduced volatility. The average volatility over the past 1.5 months is 75 pips, which is relatively low. On Friday, volatility was even lower. However, the holidays are over, and traders will immediately be thrown into a whirlpool of events this week.
We should begin with the events in Venezuela that occurred on Saturday. Trump, "who always backs down," this time moved from words to deeds and ordered the bombing of Caracas and other Venezuelan cities. Recall that for two months the U.S. president had been demanding that Venezuelan president Nicolas Maduro resign, warning that otherwise the U.S. would be forced to intervene. Trump accuses Maduro of sheltering drug trafficking and terrorism, which harm America. During the special military operation, Maduro was captured by U.S. forces and deported to the United States, where he is to stand trial.
Frankly, it is difficult to say how the market will react to this event today, but the reaction may be quite strong. The dollar may well strengthen its position, but for how long? In the UK, there will be very few significant events and reports next week. But in the U.S.... The first working week of the month means that labor market and unemployment data will be published, on which traders currently base their trading primarily. However, in addition to these data, there will be other important reports that should not be ignored.
On Monday, the ISM manufacturing PMI will be published, which risks remaining below the "waterline" for December. On Wednesday, the JOLTS, ADP, and ISM services reports will be released. The JOLTs report is unlikely to provoke a strong market reaction because it broadly reflects the state of the U.S. labor market. The ADP report is slightly more important and is unlikely to show a strong reading (judging by forecasts), while the ISM services index may fall for December from 52.6 to 52.3 points.
On Friday, Nonfarm Payrolls and the unemployment rate for December will be published, along with the University of Michigan consumer sentiment index. The market expects that the number of jobs created outside the agricultural sector will be lower than in November, while the unemployment rate will remain unchanged at 4.6%. However, note that 60,000 new jobs is very little to call the U.S. labor market "recovering." Thus, during the current week, the dollar is more likely to fall than to rise. Overall, this is desirable because the technical picture still points to an uptrend, and with poor U.S. data, it will be much easier for both currency pairs to rise. At the same time, we remind you that forecasts are only forecasts, and actual report values often differ dramatically.
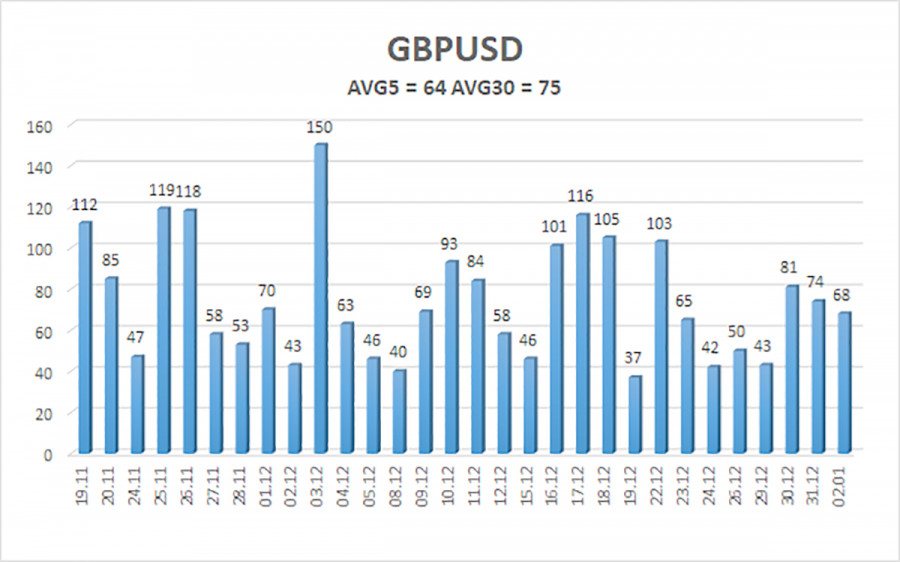
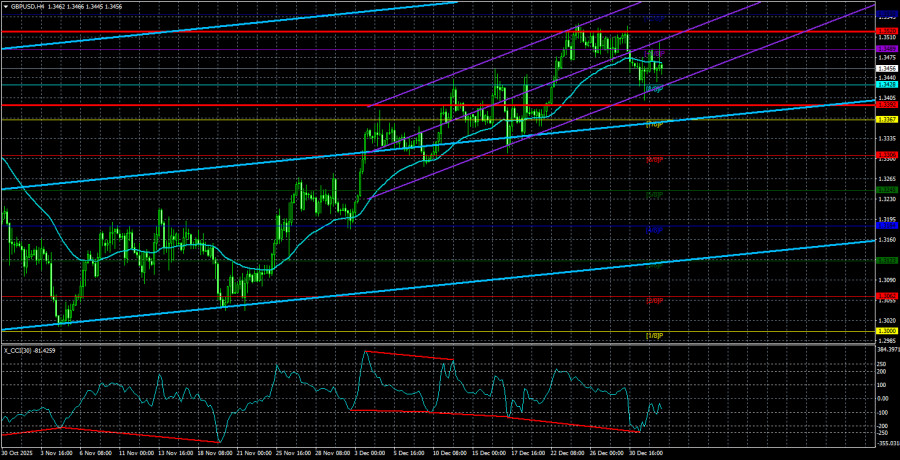
The average volatility of the GBP/USD pair over the last five trading days is 64 pips. For the pound/dollar, this value is "medium-low." On Monday, January 5, we therefore expect movement within a range of 1.3392 to 1.3520. The higher linear regression channel has turned upward, indicating a trend recovery. The CCI indicator entered the oversold area 6 times over recent months and formed numerous "bullish" divergences, which repeatedly warned traders of the continuation of the uptrend.
Nearest support levels:
S1 – 1.3428
S2 – 1.3367
S3 – 1.3306
Nearest resistance levels:
R1 – 1.3489
R2 – 1.3550
Trading recommendations:
The GBP/USD pair is attempting to resume the 2025 uptrend, and its long-term prospects have not changed. Donald Trump's policies will continue to pressure the U.S. economy, so we do not expect the U.S. currency to appreciate. Thus, long positions with a target of 1.3550 remain relevant in the near term while the price is above the moving average. A price below the moving average suggests considering small short positions on technical grounds, with targets at 1.3392 and 1.3367. From time to time, the U.S. currency shows corrections (in the global context), but for a trend to strengthen, it needs signs of an end to the trade war or other global positive factors.
Explanations for illustrations:
- Linear regression channels help determine the current trend. If both are directed the same way, the trend is strong;
- The moving average line (settings 20,0, smoothed) defines the short-term trend and the direction in which trading should currently be conducted;
- Murrey levels are target levels for moves and corrections;
- Volatility levels (red lines) are the likely price channel in which the pair will spend the next 24 hours based on current volatility indicators;
- The CCI indicator — its entry into the oversold area (below -250) or into the overbought area (above +250) indicates that a trend reversal to the opposite direction is approaching.
Смотрите также