Trading Recommendations and Analysis for EUR/USD on March 3. The Dollar's Star Moment
Trading plan
2026-03-03 02:29:24
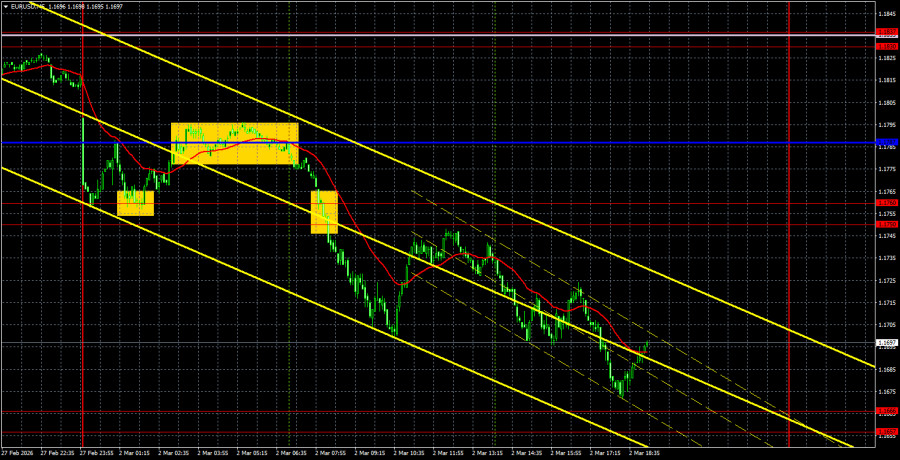
Analysis of EUR/USD 5M
The EUR/USD currency pair failed to hold off a new decline on Monday. Over the weekend, we mentioned that the reaction on Monday could be unpredictable. We meant that there could be no 100% certainty in the pair's decline. However, we did indeed see a drop. It likely played a role that the conflict in the Middle East is nothing like a military operation, as Donald Trump convinced everyone. A military operation is akin to the capture of the Venezuelan president. What is happening in Iran and neighboring countries can only be described as hell. Iran is being bombed from all sides, and it is responding in kind. Trump has already announced the readiness to send ground troops, which will certainly mean America's official entry into the war.
So why is the dollar rising if the US may find itself in a state of martial law for the first time in years? The reason is that the market is using the dollar as a safe haven, out of habit. However, in our opinion, the further Trump goes with the war, the more American soldiers die in this conflict, and the fewer objectives are achieved in Iran, the higher the probability of another plunge in the US currency. Recall that the factors for the dollar's decline have not diminished in the first two months of 2026. However, the circumstances allow it to rise.
On the 5-minute timeframe on Monday, two signals were formed that traders could act on. Just before the European trading session began, the price bounced off the Kijun-sen line, allowing traders to open short positions. Shortly after, the 1.1750-1.1760 area was broken, and the price subsequently almost reached the 1.1657-1.1666 area. Thus, the only short position was profitable in any case.
COT Report
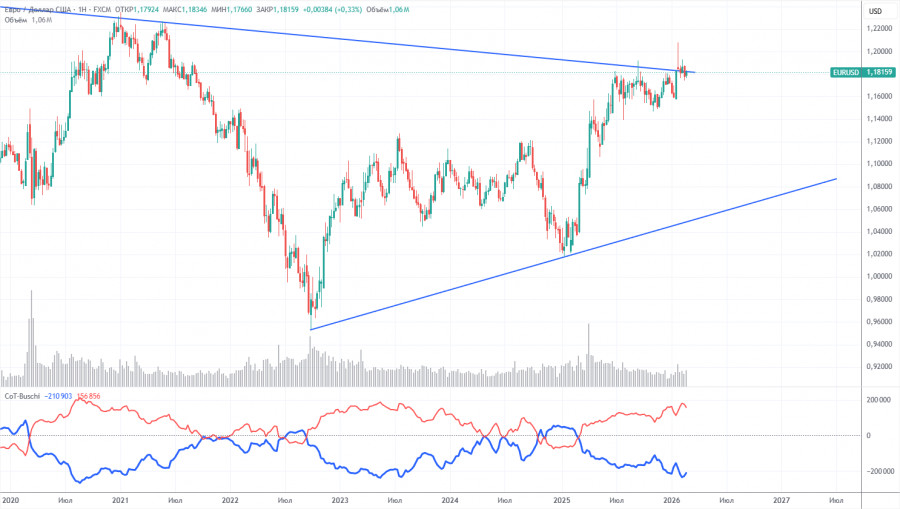
The latest COT report is dated February 24. The illustration on the weekly timeframe clearly shows that the net position of non-commercial traders remains "bullish," and since Trump took office for a second time, the dollar has only been declining. We cannot say with 100% certainty that the dollar's decline will continue, but current developments around the world suggest this is likely.
We still do not see any fundamental factors that would strengthen the euro, while there are sufficient factors for the dollar's decline. The global downward trend is still intact, but how relevant is it now, given that the price has moved over the last 18 years? Since September 2022, a new upward trend has formed, breaking the global descending trend line. Thus, the path upward is open.
The positions of the red and blue lines of the indicator continue to indicate the preservation of the "bullish" trend. Over the past reporting week, the number of long positions in the "Non-commercial" group decreased by 16,700, while the number of short positions increased by 900. Consequently, the net position fell by 15,800 contracts over the week.
Analysis of EUR/USD 1H
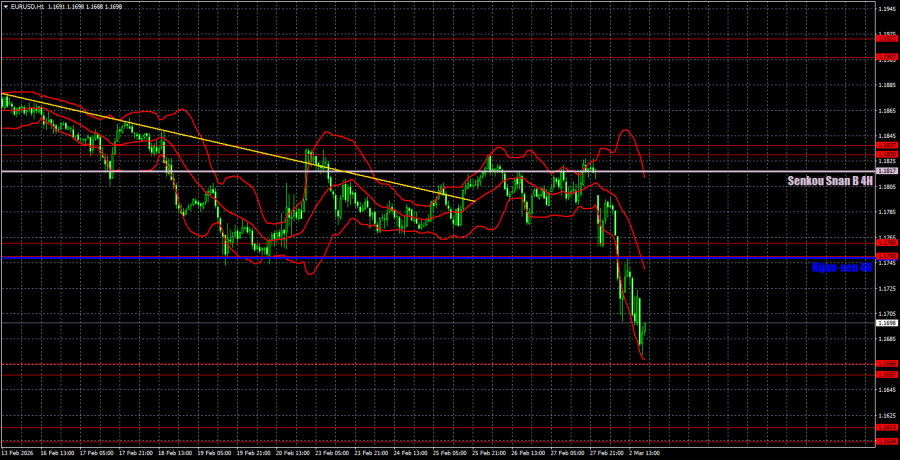
On the hourly timeframe, the EUR/USD pair has resumed its downward movement, this time amid geopolitical tensions in the Middle East. How long the dollar's rise will continue based solely on this factor is unclear, as it will depend on the intensity and duration of the war, losses on both sides, and the US's ability to achieve its objectives. However, we currently have a renewed downward trend.
For March 3, we highlight the following trading levels: 1.1362, 1.1426, 1.1542, 1.1604-1.1615, 1.1657-1.1666, 1.1750-1.1760, 1.1830-1.1837, 1.1907-1.1922, 1.1971-1.1988, 1.2051, and 1.2095, as well as the Senkou Span B line (1.1817) and the Kijun-sen line (1.1750). The lines of the Ichimoku indicator may move throughout the day, which should be taken into account when determining trading signals. Don't forget to set stop-loss orders to break even if the price moves 15 pips in the right direction. This will protect against potential losses if the signal turns out to be false.
On Monday, a report on inflation is scheduled for release in the Eurozone, which could be considered an important event. However, we assume that the market will also be entirely focused on the war in the Middle East today. We do not believe this factor will support the dollar for another week or two, but the consequences of the conflict in Iran are already strongly reflected in financial and commodity markets. Thus, the correlation may differ somewhat. The more turmoil in the financial markets, the stronger the dollar will be.Trading Recommendations:
On Tuesday, traders may consider selling with targets of 1.1604-1.1615 and 1.1542 if the price consolidates below the 1.1657-1.1666 area. Long positions can be considered with a target of 1.1750-1.1760 if the price bounces from the 1.1657-1.1666 area.
Explanations for Illustrations:
- Price levels of support and resistance are indicated by thick red lines, where movement may end. They do not serve as sources of trading signals.
- The Kijun-sen and Senkou Span B lines are Ichimoku indicator lines that are transferred from the 4-hour timeframe to the hourly timeframe. They are strong lines.
- Extreme levels are indicated by thin red lines from which the price has previously bounced. They are sources of trading signals.
- Yellow lines indicate trend lines, trend channels, and any other technical patterns.
- Indicator 1 on the COT charts shows the size of the net position for each category of traders.
Смотрите также