analytics1_1
Trading Recommendations and Analysis of GBP/USD for March 12. Illusions, Hopes, and Dreams
Trading Recommendations and Analysis of GBP/USD for March 12. Illusions, Hopes, and Dreams
Trading plan
2026-03-12 02:55:26
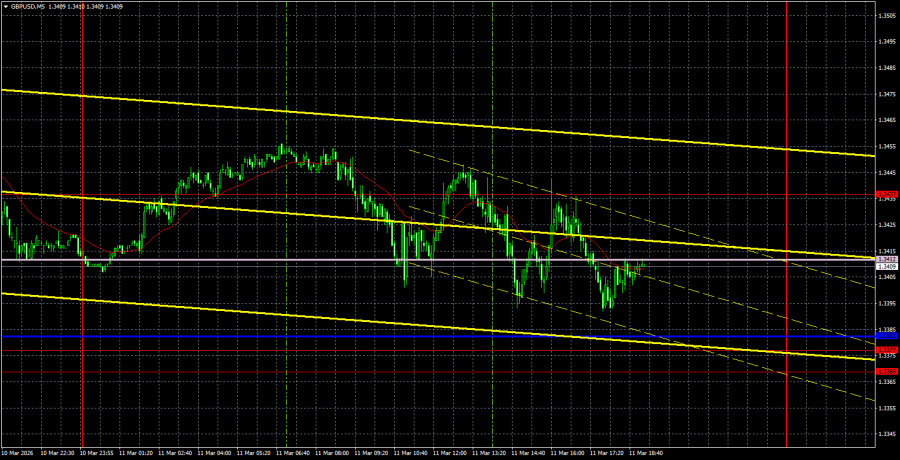
Analysis of GBP/USD 5M
The GBP/USD currency pair also traded lower on Wednesday. The reasons are the same as for the EUR/USD pair—sharp deterioration of the geopolitical backdrop due to actions and statements by Iranian officials. The U.S. inflation report had no impact on the dollar's exchange rate and likely wouldn't have, even if it had shown a meaningful value. Thus, despite breaching the Senkou Span B line, the British pound once again failed to build on its local success.
From a technical standpoint, we have adjusted the trend line, which now passes through the last three extreme highs. Consequently, as long as it is not breached, it is unlikely that we can expect a rise in the British currency. Even if the trend line is broken, it is essential to remember that geopolitics currently outweigh fundamental, technical, and macroeconomic factors. Thus, a decline could resume at any moment if the situation in the Middle East worsens further.
On the 5-minute timeframe, movements on Wednesday were so erratic that we didn't even highlight trading signals. The price fluctuated throughout the day, reacting unpredictably. It seems that there are significant resistances both from above and below for the British pound, and bulls and bears are fiercely pulling the rope back and forth. All lines and levels were ignored during the day.
COT Report
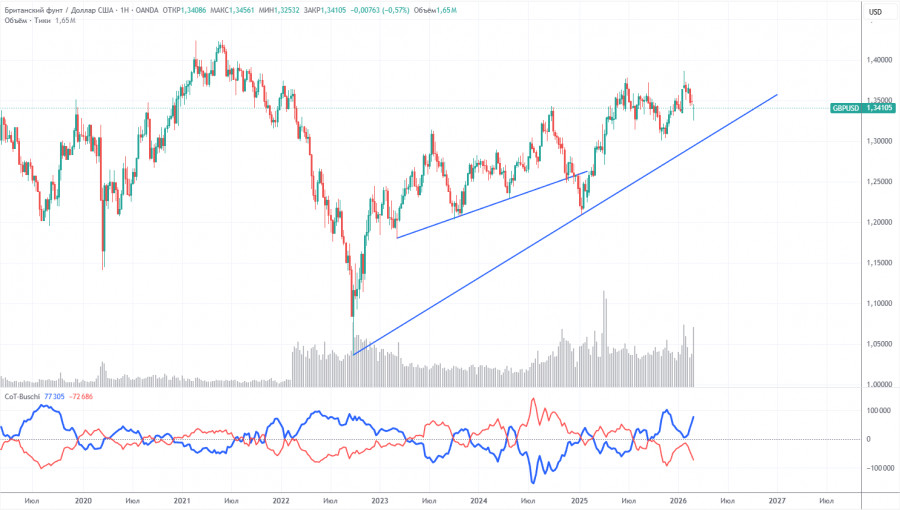
COT reports on the British pound show that sentiment among commercial traders has been changing frequently in recent years. The red and blue lines, which represent the net positions of commercial and non-commercial traders, frequently cross and are mostly close to the zero mark. Currently, the lines are moving apart, with non-commercial traders still dominating on the sell side. Recently, speculators have been actively increasing long positions, but they have not managed to shift into a zone of their own superiority.
The dollar continues to decline due to Donald Trump's policies, as seen on the weekly timeframe (illustration above). The trade war will continue in one form or another for a long time, and the Fed will, in any case, reduce rates over the next 12 months. Demand for the dollar will gradually fall. According to the latest COT report (from March 3) on the British pound, the "Non-commercial" group closed 7,700 BUY contracts and opened 7,900 SELL contracts. Thus, the net position of non-commercial traders decreased by another 15,600 contracts over the week.
In 2025, the pound has risen significantly, but it should be understood that there is only one reason: Trump's policies. Once this reason is neutralized, the dollar may begin to rise. But when this will happen—nobody knows.
Analysis of GBP/USD 1H
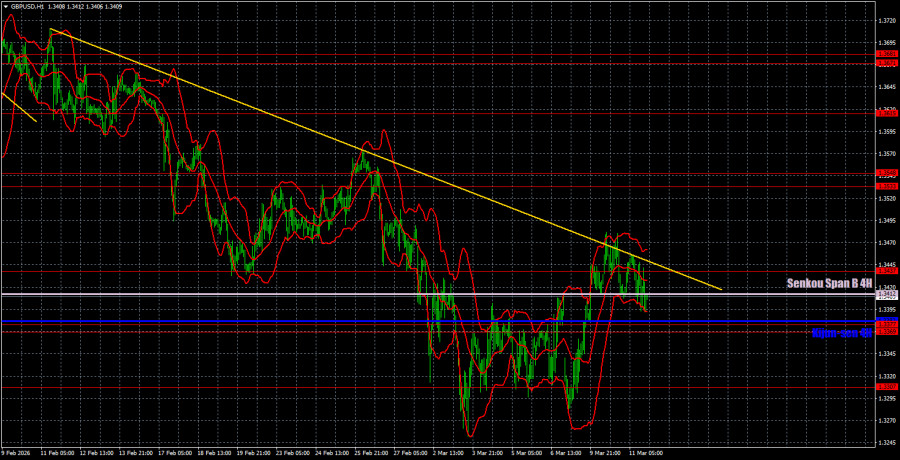
On the hourly timeframe, the GBP/USD pair could have shifted to forming an upward trend long ago, but geopolitics continues to drag the British pound down. Despite the steep decline of the pair in February-March, we still regard it as a correction. The daily timeframe confidently signals the maintenance of an upward trend. Unfortunately, geopolitics is very unpredictable and can overshadow all other factors.
For March 12, we highlight the following important levels: 1.3096-1.3115, 1.3201-1.3212, 1.3307, 1.3369-1.3377, 1.3437, 1.3533-1.3548, 1.3615, 1.3671-1.3681, 1.3751-1.3763. The Senkou Span B line (1.3412) and the Kijun-sen line (1.3382) may also be sources of signals. It is recommended to set the stop-loss order to breakeven after the price moves in the correct direction by 20 pips. The lines of the Ichimoku indicator may shift during the day, which should be taken into account when determining trading signals.
On Thursday, the UK is scheduled to host a speech by Bank of England Governor Andrew Bailey, but it is difficult to gauge how significant this event will be for the market under current circumstances. In the U.S., several less important reports will be released, which traders will likely ignore.
Trading Recommendations:
Today, traders may consider opening short positions targeting 1.3307 if the pair consolidates below the 1.3369-1.3377 area. Long positions will become relevant with a target area of 1.3533-1.3548 if the Senkou Span B line and the trend line are overcome by the bulls.
Explanations for the Illustrations:
- Price levels of support and resistance – thick red lines, around which movement may end. They are not sources of trading signals.
- Kijun-sen and Senkou Span B lines are lines from the Ichimoku indicator transferred to the hourly timeframe from the 4-hour timeframe. They represent strong lines.
- Extreme levels – thin red lines from which the price previously bounced. They are sources of trading signals.
- Yellow lines – trend lines, trend channels, and any other technical patterns.
- Indicator 1 on the COT charts – the size of the net position for each category of traders.
Смотрите также