analytics1_1
Trading Recommendations and EUR/USD Trade Analysis for June 10. Logical Growth, Unexplained Crash
Trading Recommendations and EUR/USD Trade Analysis for June 10. Logical Growth, Unexplained Crash
Trading plan
2026-06-10 02:03:37
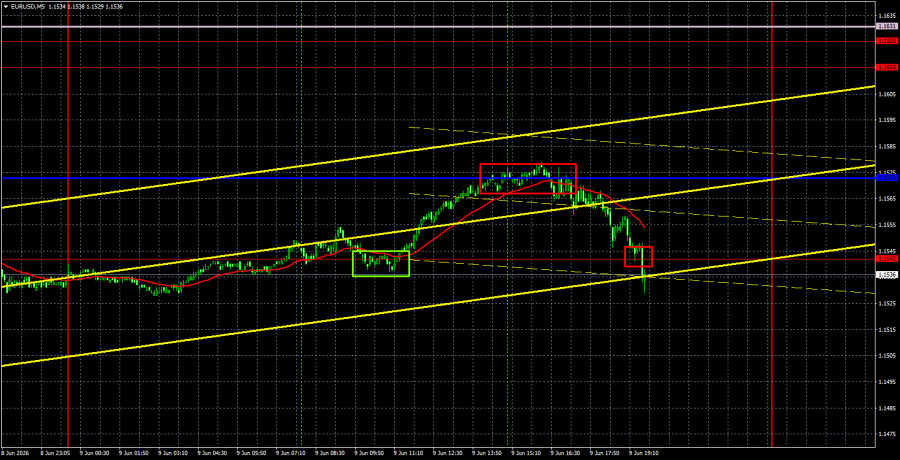
EUR/USD Analysis 5M
The EUR/USD currency pair continued to trade in varying directions on Tuesday. In the first half of the day, an increase was observed, which may have been prompted by more of Donald Trump's promises about the closeness of a deal with Iran. However, in the second half of the day, a crash occurred, triggered by one event—the Iranian government's denial of Trump's statements. Let's remember that the U.S. president has promised a deal "within the next couple of days, a couple of weeks" before. However, in all previous cases, Iranian officials denied these promises. On Tuesday, Trump stated not only about the closeness of an agreement but also about Iran's consent to abandon nuclear weapons. We are almost certain that this information is not accurate. Therefore, it is currently unclear what caused the sharp rise of the dollar in the second half of the day, but we assume it relates to official statements from Tehran. Thus, geopolitical fluctuations continue to manifest themselves vividly, and the geopolitical backdrop can change multiple times within a day.
From a technical perspective, the downward trend has resumed, but whether it will continue remains a big question. If Tehran and Washington somehow sign a deal, demand for the U.S. currency will decrease. If inflation in the U.S. begins to slow, the Federal Reserve will not face a dilemma about whether to tighten monetary policy, which would also weaken the position of the U.S. dollar. A new inflation report will be published today.
On the 5-minute timeframe, several trading signals were formed on Tuesday. Initially, the pair perfectly bounced off the level of 1.1542, allowing traders to open long positions. Afterward, the price bounced off the critical line, creating an opportunity for short positions. By the end of the day, the 1.1542 level was reached, so traders could open two trades and profit on both.
COT Report
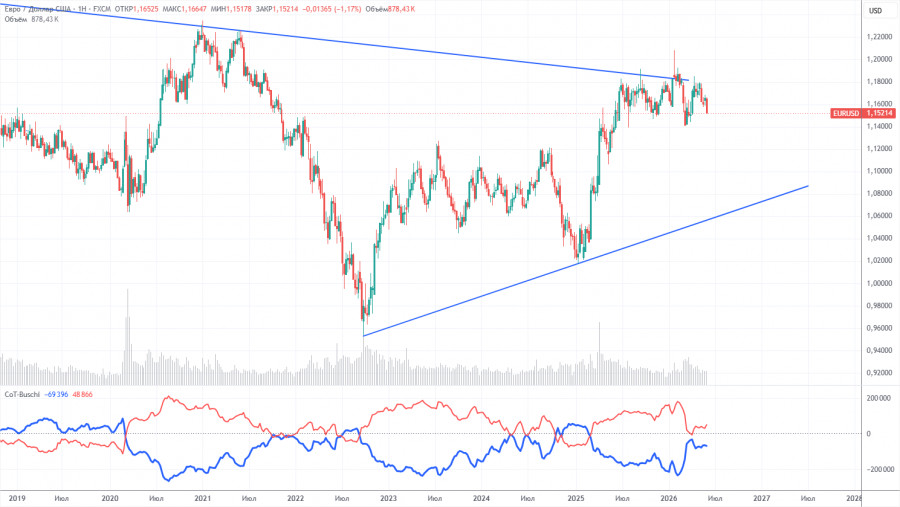
The latest COT report is dated June 2. On the weekly timeframe illustration, it is evident that the net position of non-commercial traders remains "bullish," but has significantly decreased due to geopolitical events. Traders have been shedding the European currency in favor of the U.S. dollar in recent months. Trump's policies have not changed, but the dollar has served as a "reserve currency" for some time. However, this process may already be complete.
We still do not see any fundamental factors to strengthen the European currency, while there are plenty of factors for the U.S. dollar to decline. The war in the Middle East made the dollar temporarily super attractive, but when this factor runs out of "shelf life," everything will revert to the way it was. And that shelf life may have already expired. In the long term, the euro may decline to $1.08 (the trend line), but the upward trend will still remain relevant. Over the past few months, the pair has not come very close to this line.
The positioning of the indicator's red and blue lines suggests parity between bulls and bears. Over the last reporting week, the number of longs in the "Non-commercial" group increased by 12,400, while the number of shorts decreased by 7,000. Consequently, the net position increased by 21,400 contracts in a week.
EUR/USD Analysis 1H
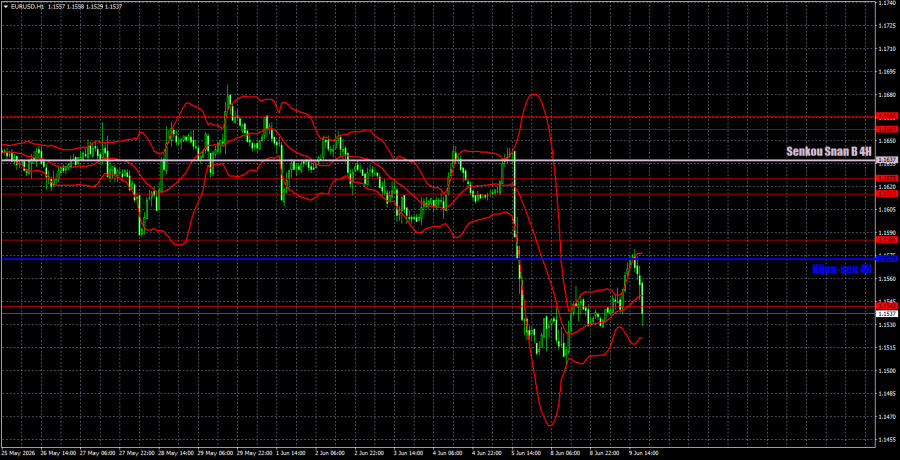
On the hourly timeframe, the EUR/USD pair has resumed its downward trend. The situation in the Middle East remains tense; it is not worsening, but Washington and Tehran cannot agree on at least a temporary peace deal. If new signs of a resumption of war in the Middle East do not emerge and a memorandum of understanding is signed, the dollar will begin to lose positions. But for now, we see neither a deal nor a resurgence of war.
For June 10, we highlight the following important trading levels: 1.1362, 1.1426, 1.1542, 1.1585, 1.1615-1.1625, 1.1657-1.1666, 1.1750-1.1760, 1.1786, 1.1830-1.1837, 1.1907-1.1922, as well as the Senkou Span B line (1.1637) and Kijun-sen (1.1573). The Ichimoku indicator lines may move throughout the day, which should be factored into the determination of trading signals. Don't forget to set a Stop Loss at breakeven once the price moves 15 pips in the correct direction. This will protect against potential losses if the signal proves false.
On Wednesday, only one report is scheduled for release in the Eurozone and the U.S., and it is quite significant. Inflation in the U.S. is virtually guaranteed to accelerate in May, but the market may ignore this report as it has been prone to doing lately. However, a sharp rise in inflation will increase the probability that the Fed will tighten monetary policy in 2026.
Trading Recommendations:
Today, traders may consider short positions targeting 1.1444 if the price consolidates below 1.1542. Long positions can be opened if there is consolidation above 1.1542, with a target of 1.1585.
Explanations for Illustrations:
Support and resistance price levels are indicated by thick red lines, around which movement may end. They are not sources of trading signals.
The Kijun-sen and Senkou Span B lines are Ichimoku indicator lines transferred to the hourly timeframe from the 4-hour timeframe. They are strong lines.
Extremum levels are indicated by thin red lines from which the price has previously bounced. They are sources of trading signals.
Yellow lines indicate trend lines, trending channels, and any other technical patterns.
Indicator 1 on the COT charts shows the size of the net position for each category of traders.
Смотрите также