analytics1_1
How to Trade EUR/USD on November 9: Simple Tips and Trade Analysis for Beginner Traders
How to Trade EUR/USD on November 9: Simple Tips and Trade Analysis for Beginner Traders
Trading plan
2026-11-09 05:23:15
Friday's Trade Review:
EUR/USD 1H Chart
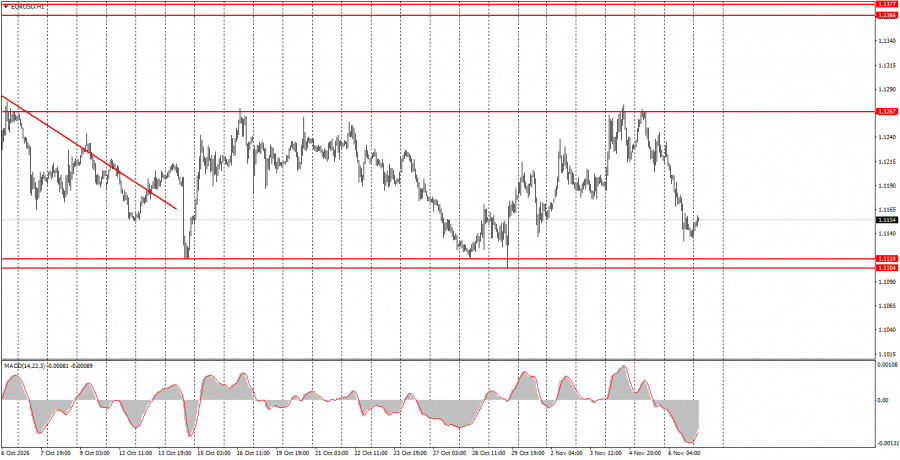
The EUR/USD currency pair plunged on Friday. However, the decline had already begun on Thursday, after the price once again failed to break above the 1.1267 level, which marks the upper boundary of the sideways channel. The sideways channel is clearly visible on the hourly timeframe, and the price has remained within it for more than a month. Thus, the euro's decline was driven by technical factors rather than the Nonfarm Payrolls report and the unemployment rate, as many believe. Nevertheless, it is worth acknowledging that both major US labor market reports came in significantly better than forecast. As a result, the dollar received additional market support during the final third of Friday's trading session. At present, the price is approaching the 1.1104–1.1114 level, which marks the lower boundary of the sideways channel. Therefore, either a rebound or a breakout should be expected. As has been noted repeatedly, there are no clear reasons for further US dollar appreciation after its uninterrupted growth over the past 2.5 months.
EUR/USD 5M Chart
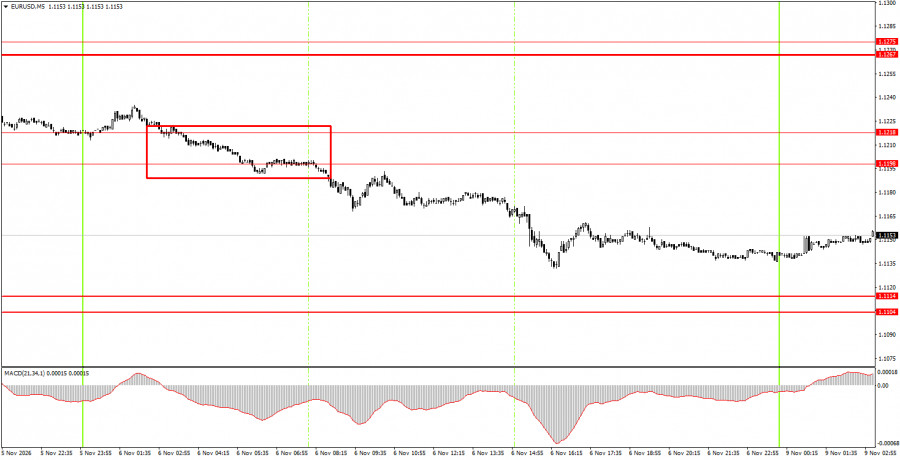
On the 5-minute timeframe, one sell signal was generated on Friday. At the very beginning of the European trading session, the price broke below the 1.1198–1.1218 level, allowing beginner traders to open straightforward short positions. By the end of the day, the euro had declined by at least 40 points, offering traders an opportunity to secure a profit.
How to Trade on Monday:
On the hourly timeframe, EUR/USD maintains a downward trend, which qualifies as an established trend, while continuing to trade sideways between the 1.1114 and 1.1267 levels. The euro has failed to stage a meaningful correction in recent weeks, although the possibility of an upward trend emerging remains. Taking into account all the developments of recent months, there is no clear justification for such a sharp decline in the euro. At present, the US dollar is significantly overbought, while a large number of factors supporting the euro are being ignored by the market.
On Monday, beginner traders may consider opening short positions if the price consolidates below the 1.1104–1.1114 level, with a target of 1.1011. Buy trades may be considered if the price rebounds from the 1.1104–1.1114 level, with a target of 1.1198–1.1218.
On the 5-minute timeframe, the following levels should be monitored: 1.1011, 1.1104–1.1114, 1.1198–1.1218, 1.1267–1.1275, 1.1366–1.1377, 1.1461–1.1474, 1.1527–1.1531, 1.1584–1.1594, and 1.1655–1.1665.
There are no significant economic events scheduled for Monday in Germany, the European Union, or the United States. Therefore, volatility may remain low, and the price is unlikely to leave the sideways channel.
Main Rules of the Trading System:
- Signal strength is determined by the time required for a signal to form (a rebound or a breakout of a level). The less time required, the stronger the signal.
- If two or more trades are opened near a particular level based on false signals, all subsequent signals from that level should be ignored.
- During sideways markets, any currency pair may generate numerous false signals or none at all. Technical levels may also be disregarded by price action.
- On the hourly timeframe, trading based on MACD indicator signals is advisable only when volatility is sufficiently high and a trend is present, confirmed by a trendline or trend channel.
- If two levels are located too close to each other (within 5–20 pips), they should be treated as a single support or resistance zone.
- Once the price has moved 15 pips in the correct direction, the Stop Loss should be moved to breakeven.
What the Charts Show:
Support and resistance price levels (zones) are levels that serve as targets for opening buy or sell positions or as sources of trading signals.
Red lines represent channels or trendlines that illustrate the current trend and indicate the preferred direction for trading.
MACD indicator (14, 22, 3) – the histogram and signal line serve as auxiliary indicators that can also be used to generate trading signals.
Important speeches and economic reports (listed in the economic calendar) can have a significant impact on currency pair movements. Therefore, trading should be approached with extreme caution when such events are taking place. Alternatively, positions may be closed to avoid the risk of a sharp price reversal against the prevailing movement.
Beginner Forex traders should remember that not every trade can be profitable. Developing a clear trading strategy and following sound money management principles are essential for long-term trading success.
Смотрите также