Strategy's Bitcoin investments back in red
Crypto-currencies
2026-11-11 05:27:53
Bitcoin and Ether continue their downward move, repeatedly fed by fresh negative headlines. Recall that recent developments for the crypto world have been uniformly negative. Central banks—notably the Fed—keep tightening policy, the Clarity Act remains only a bill, Democrats won the U.S. congressional elections—further reducing the odds that the Clarity Act becomes law—and historically Bitcoin tends to fall after midterms (which we are seeing now). Two weeks ago the list of headwinds grew with the hack of the world's largest crypto exchange, Binance. That was followed by a stock market collapse and a rout in tech shares, which many experts closely link to Bitcoin's price. This week U.S. inflation accelerated more than forecasts. Taken together, the fundamentals for further growth in the crypto market remain, to put it mildly, doubtful. We do not deny that the asset can rally in any news environment, but at present there are no technical signals or fundamental grounds for a sustained rise.
Meanwhile, Bitcoin's price has fallen below Strategy's average purchase price. In plain terms, the Bitcoin investments of Michael Saylor's company—which, by the way, continues to buy digital gold—are back in the red. Strategy has been investing in Bitcoin for six years, essentially buying any excess cash. Experts also note that outflows from spot ETFs continue. How can Bitcoin rise if capital keeps running away from it? It is also worth noting that the current Bitcoin price is very close to the global average mining breakeven. Many large and private miners have spent more than a year retooling equipment and compute capacity for AI workloads, which deliver more stable and predictable returns. If Bitcoin's price continues to fall, mining will again become unprofitable for some "gold-digging" companies. What will happen then? A number of miners will simply exit the market.
Other articles to read:
EUR/USD review. November 11. USD keeps surprising with its strength
GBP/USD review. November 11. How US inflation affects market?
Should you take Donald Trump at his word?
How to trade EUR/USD on November 11? Simple tips and trade breakdowns for beginners
How to trade GBP/USD on November 11? Simple tips and trade breakdowns for beginners
What to watch on November 11? Fundamental events explained for beginners
Interpretation of EUR/USD analysis results on November 11
Interpretation of GBP/USD analysis results on November 11
Trading recommendations for BTC/USD:
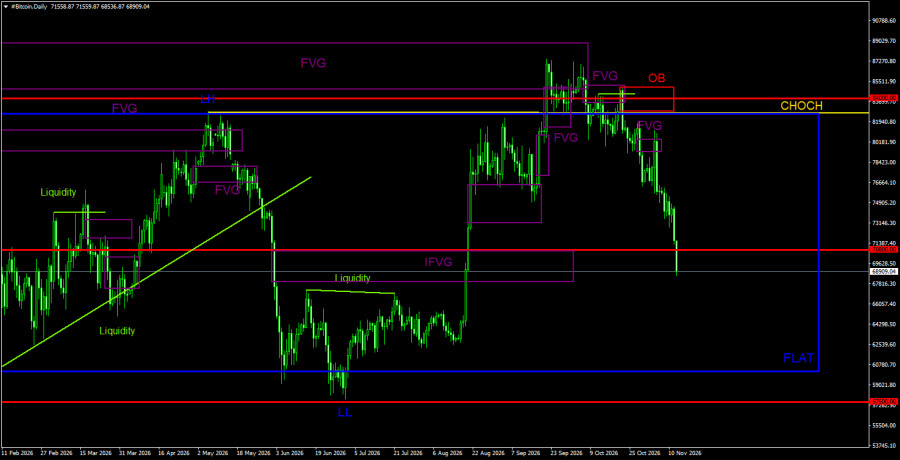
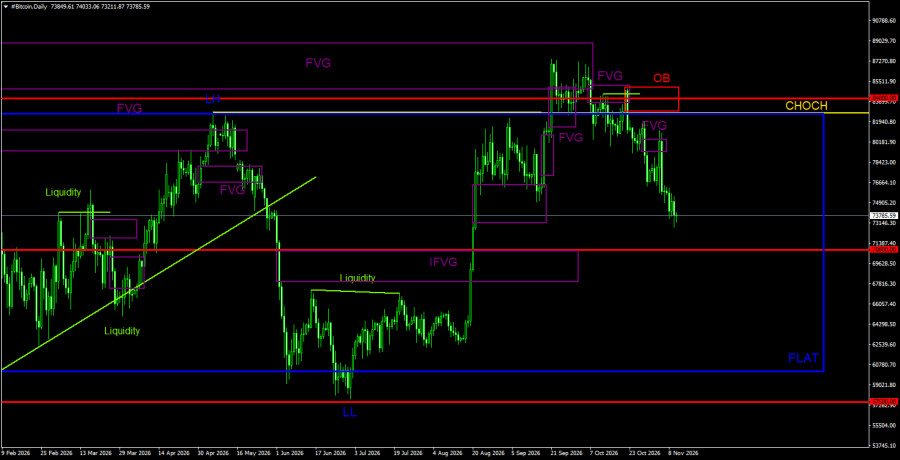
Bitcoin attempted to start a new uptrend, but the fundamental backdrop, spot demand, and recent news are too negative to count on continuation. On the daily timeframe, Bitcoin may remain in decline, as the price has already reacted to three bearish FVGs and formed a bearish order block. A move outside the daily sideways channel is interpreted as a deviation. Thus, Bitcoin generated a reversal signal and set a course for $70,800. We do not consider the bearish trend finished. Short positions are more relevant than longs in the near term. Note the active bearish FVG on the daily chart, around which a sell signal formed. On the 4-hour timeframe, two new bearish FVGs have formed; reactions to them may give traders opportunities to open new short positions.
Trading recommendations for ETH/USD:
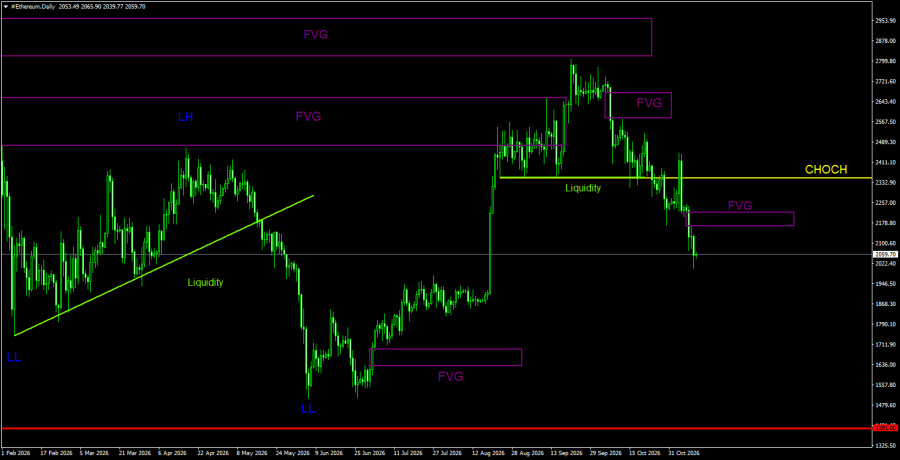
The daily technical picture for Ether has changed. Ether produced a significant upward impulse in June–September 2026 that could mark the start of a new long-term trend. However, at the same time, there is no confidence that Bitcoin's bear market has ended. If Bitcoin remains in a downtrend or even a flat, do not expect Ether to rally. Bitcoin has generated enough sell signals and bearish patterns on the daily chart to continue its decline. Therefore, we also expect Ether to fall, with targets near $1,850 and $1,391. On the 4-hour timeframe, two new bearish FVGs formed that traders can use to open short positions.
Illustration notes:
CHOCH — change of trend structure.
Liquidity—liquidity, stop losses, and pending orders that market makers use to build positions.
FVG—fair value gap. A price inefficiency area that price traverses quickly, indicating the absence of one side of the market; thereafter price tends to return and react to such areas in continuation of the main trend.
IFVG — inverted fair value gap. After returning to such an area, the price often does not react but impulsively breaks through and then tests from the other side.
OB — order block. The candle where a market maker opened a position aiming to take liquidity to form a position in the opposite direction.
Смотрите также