The War in Iran Will Help Bitcoin
Crypto-currencies
2026-03-04 05:51:58
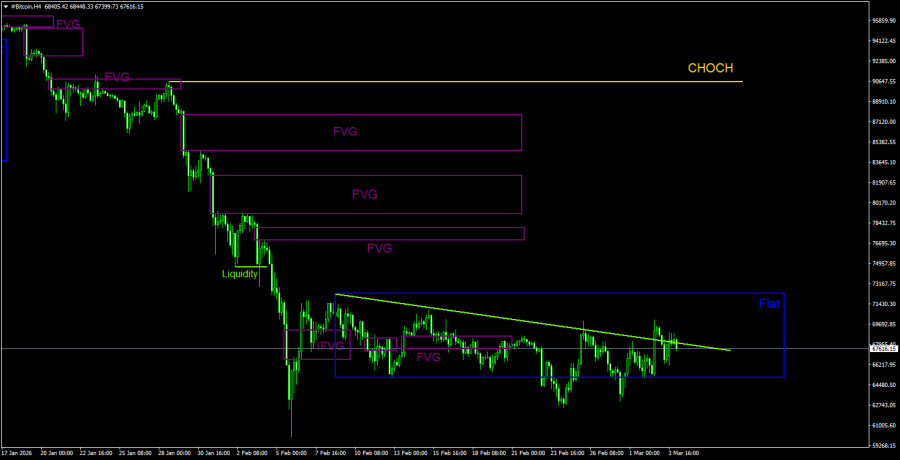
Bitcoin still shows no signs of recovery. Moreover, signs of a new decline in "digital gold" are emerging. First, liquidity has been removed from the trend line on the 4-hour timeframe. Second, the bulls are currently so weak that, after two deviations, they have never once reached the upper boundary of the channel. The flat has continued for three weeks, but the price is gradually sliding down. Therefore, there are much higher chances for a new decline in "digital gold" than for its growth. Any significant growth in the first cryptocurrency can be discussed only after the quotes break out of the sideways channel through the upper boundary.
Meanwhile, more experts believe that the war in Iran will bring dividends to Bitcoin. Some point to the potential rise in worldwide inflation due to rising energy prices and the Fed's additional dollar issuance to finance the war. A new rise in inflation may prompt investors to once again address the issue of capital preservation. Bitcoin may once again start serving as a hedge against inflation alongside gold.
Experts from the London Crypto Club also report that investors, by purchasing Bitcoin, may be seeking refuge not only from the devaluation of fiat currencies but also from a potential collapse of political structures and the economic system. No one knows how far the war in the Middle East will escalate. Analysts also indicate that if the conflict concludes quickly, a wave of euphoria may occur, positively affecting all markets, including the cryptocurrency market.
Another positive aspect is the potential for the Fed to ease monetary policy due to the war in Iran. Historically, US military campaigns have inevitably provoked increased spending and further reductions in the Fed's key interest rate.
BTC/USD Trading Recommendations:
Bitcoin continues to form a full-fledged downward trend. We continue to expect a decline, targeting $57,500 (the 61.8% Fibonacci level of the three-year upward trend), and there are currently no signs of a trend reversal. However, even the $57,500 level no longer looks like a final stop. Among the points of interest (POI), the nearest "bearish" FVG on the daily timeframe is quite far from the price. We should also pay attention to deviations at the upper boundary of the sideways channel on the 4-hour timeframe, as the trend remains downward.
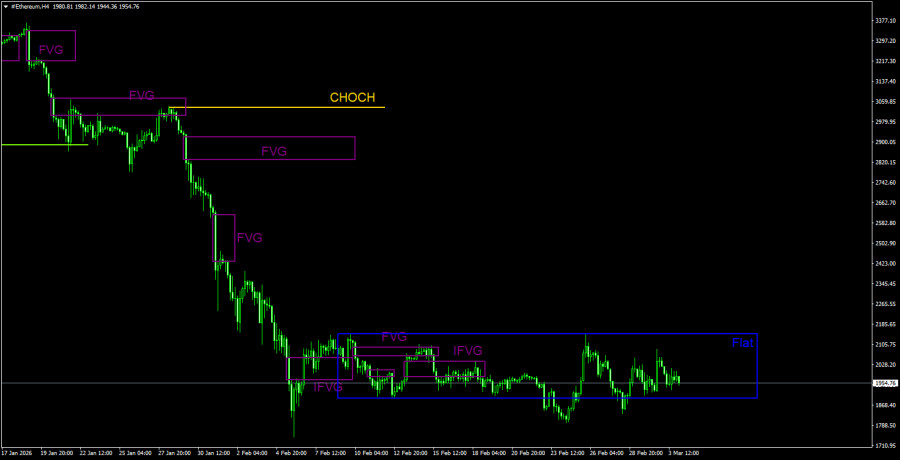
ETH/USD Trading Recommendations:
The daily timeframe continues to show a downward trend. The key pattern for selling has been and remains the bearish order block on the weekly timeframe. As we warned, the movement triggered by this signal can be strong and prolonged. After its formation, Ethereum has already declined by 55%, or $2,500. In the near future, an upward correction is expected; however, the price is still in a fairly narrow sideways channel. Trading within the flat can only be done from its boundaries. One should also not forget Bitcoin's significant influence on the entire cryptocurrency market. While no bearish patterns and signals may have formed for Ethereum, they may still be formed for Bitcoin.
Explanations for Illustrations:
- CHOCH – Change of trend structure.
- Liquidity – The liquidity and stop losses of traders that market makers use to accumulate their positions.
- FVG – Area of price inefficiency. Prices move very quickly through these areas, indicating a complete absence of one side in the market. Subsequently, prices tend to return and react to such areas.
- IFVG – Inverted area of price inefficiency. After returning to such an area, the price receives no reaction and breaks through impulsively, then tests it from the other side.
- OB – Order block. The candlestick on which the market maker opened a position to collect liquidity for forming their own position in the opposite direction.
Смотрите также