Futures pushing Bitcoin up
Crypto-currencies
2026-05-04 08:25:34
Bitcoin has been following a slightly upward move that is actually a correction for about two and a half months. This is clearly visible on the daily timeframe. A liquidity pool below remains untouched, and the price is likely to revisit it with roughly 90% probability. Last week, we saw the first signs that the correction might end, but over the weekend, Bitcoin resumed climbing. We are now waiting for the next clear signal that would confirm the end of the 2.5-month correction.
Meanwhile, CryptoQuant analysts reported that April's Bitcoin rally was driven by demand for perpetual futures while spot demand stayed negative. In plain terms, traders in April were opening leveraged long positions, indicating a speculative character to the advance. Long-term spot investors were largely selling the "digital gold." If this is mainly speculation, the market is not positioned for sustained, long-term buying, and even a small drop could trigger liquidations and profit?taking on longs. CryptoQuant also noted that such futures-driven rises typically do not change the underlying trend.
The divergence between spot and futures demand best reflects the fragility of the move. This kind of advance is built on leverage and a thirst for quick gains — it cannot be stable or long-lasting by nature. CryptoQuant also pointed to the lack of a fundamental base for further growth. Once the "futures leg" finishes, markets often move into a correction. In a bear market, the futures leg itself is merely a corrective phase, so the downtrend can resume after it ends. CryptoQuant even said the current market structure strongly resembles 2022: without a shift to positive spot demand, any rise lacks support for continuation.
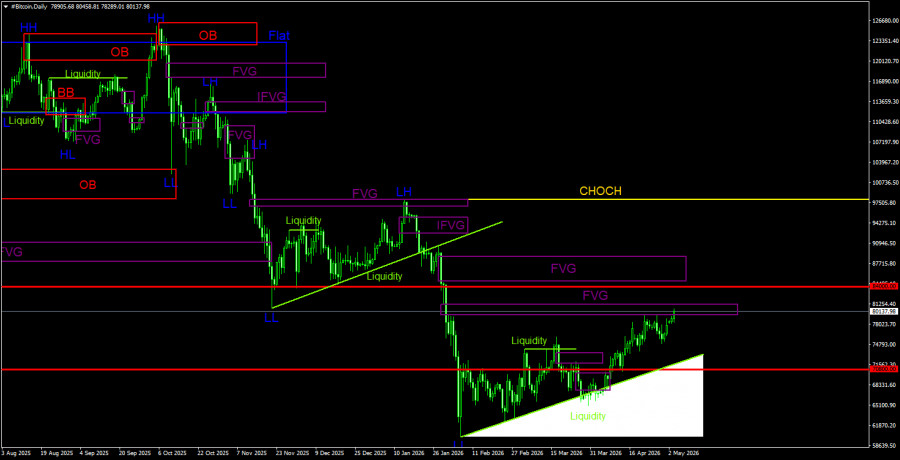
Trading recommendations for BTC/USD
Bitcoin continues to form a full downtrend with corrective rallies against it. We still expect a decline toward $57,500 (the 61.8% Fibonacci retracement of the three?year uptrend), and there are currently no signs of a trend reversal. Even $57,500 does not look like a definitive bottom. The only POI right now is the nearest bearish FVG on the daily TF around $79,300–$81,200. Bitcoin has reacted to this zone for the third time, so we would again expect a response there. However, new reversal evidence will be needed now — structure breaks on lower TFs and formation of new bearish patterns. Downside targets remain below $60,000.
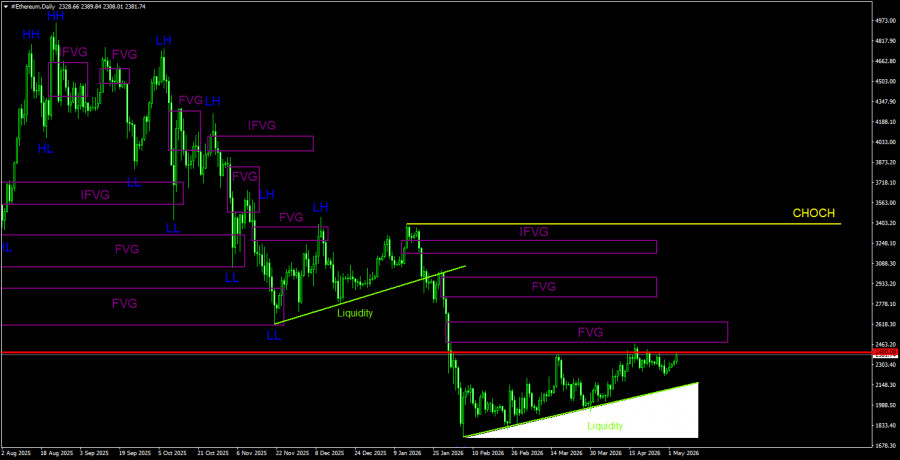
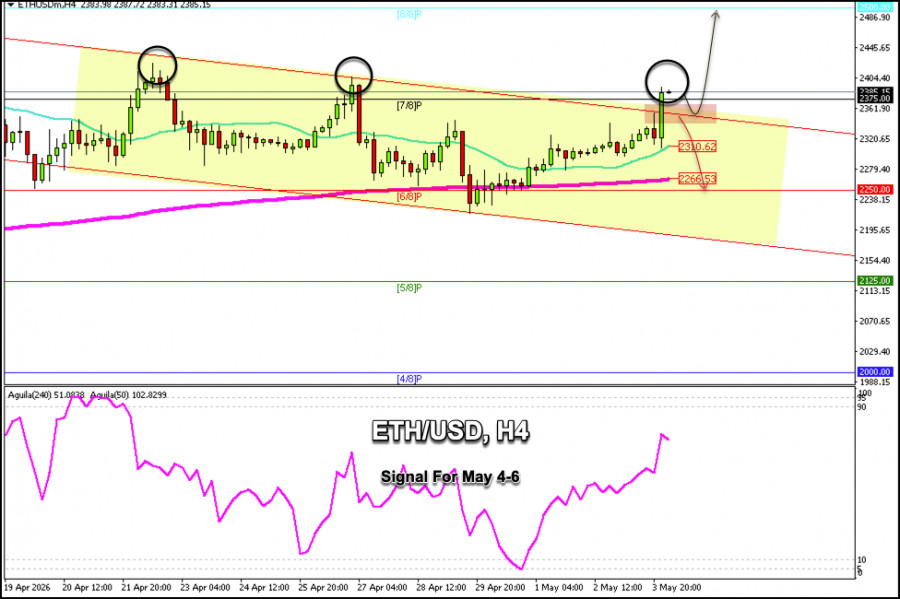
Trading recommendations for ETH/USD
On the daily TF, a downtrend and corrective moves against it are still forming. The key sell setup remains the bearish weekly order block. As we warned, the move triggered by that signal can be strong and prolonged — and we don't believe it's finished. In the near term, ETH may continue a weak upward correction, but all corrections end sooner or later. A sell signal could form on the daily TF at the next FVG, and Bitcoin may produce its own signal on a third attempt. Therefore, watch for structure breaks on lower TFs and the formation (or reaction to) bearish patterns on higher TFs. A target at the 2026 low — $1,744 — looks quite achievable.
CHOCH — change of character / break of the trend structure.
Liquidity — liquidity, traders' Stop?Losses that market?makers use to build their positions. FVG — Fair Value Gap (area of price inefficiency). The price often moves quickly through such areas, indicating the absence of one side in the market. Later, the price tends to return and react to these zones. IFVG — Inverted Fair Value Gap. After a return to such a zone, the price does not react but impulsively breaks through and then tests it from the other side.
OB — Order Block. A candle on which a market?maker opened a position in order to harvest liquidity and then form their own position in the opposite direction.
Смотрите также