Trading Recommendations for Bitcoin (BTC) on September 18 Using the ICT System
Crypto-currencies
2026-09-18 04:32:13
Bitcoin has traded in a sideways channel for three weeks. Bitcoin's inability to resume its upward move right now does not mean the local "north impulse" is over. That impulse is local. On the daily timeframe, "digital gold" is clearly inside a sideways channel. Currently, Bitcoin sits near the upper boundary of that channel. That implies a deviation may form with liquidity taken from the previous high or at least a simple rejection. In any case, the downtrend remains unbroken, as shown on the daily and weekly timeframes. On the 4-hour timeframe, price formed a deviation at the lower boundary of the sideways channel, as we warned. Therefore, a rise back to the upper boundary should be expected.
This week the Federal Reserve announced its decision and the crypto market's reaction was as surprising as the FX reaction. Recall the Fed delivered the expected 25-bp hike — generally bad news for risk assets including crypto. But the Fed did not stop there: Kevin Warsh effectively signaled further tightening, and the dot-plot showed a hawkish shift among FOMC members. In other words, the Fed is committed to fighting high inflation, and one September hike will not be the last. That outlook is not encouraging for Bitcoin. Yet the crypto market barely reacted to the Fed's outcome — which is surprising given the hawkish tilt. Bitcoin could have plunged, but it did not. Also note that the CLARITY Act failed to pass this week, a bill that had been important for Bitcoin and the broader crypto sector. Reaction to that failure was weak. Thus, technical structure takes precedence again. The technical picture allows for a modest rise due to the 4-hour deviation.
Overall BTC/USD picture on 1D
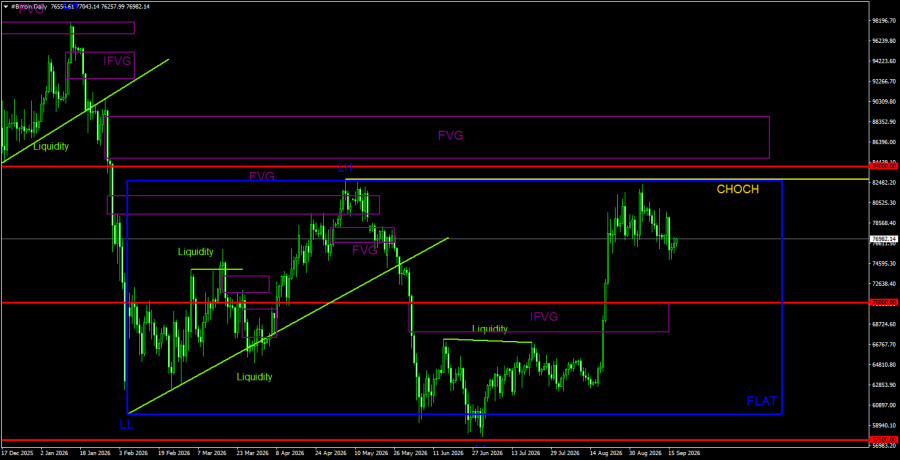
On the daily timeframe, Bitcoin continues forming a downtrend and has entered a flat phase. The trend structure is downward, and the CHOCH line is at $82,800, where the last LH (Lower High) formed. Only above that level can the downtrend be considered complete. For most of 2026, "digital gold" has traded between $60,000 and $82,500, which means price can take liquidity from the last LH and begin a new move toward the lower boundary of the sideways channel.
Overall BTC/USD Picture on 4H
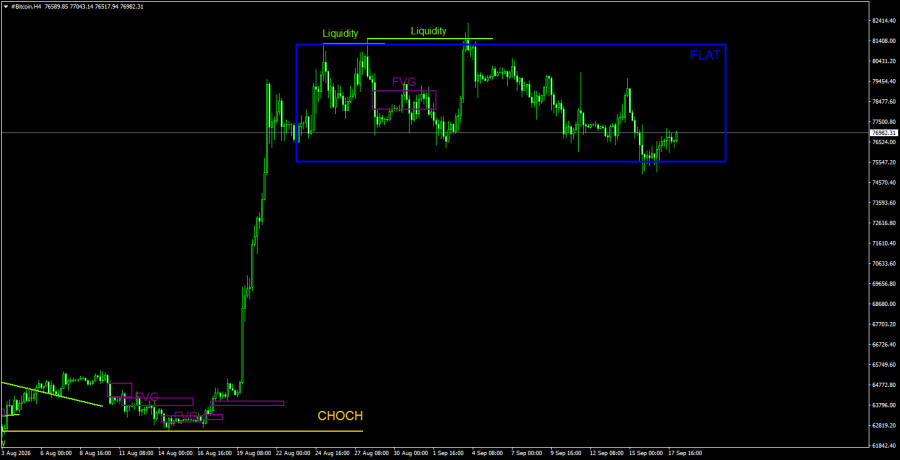
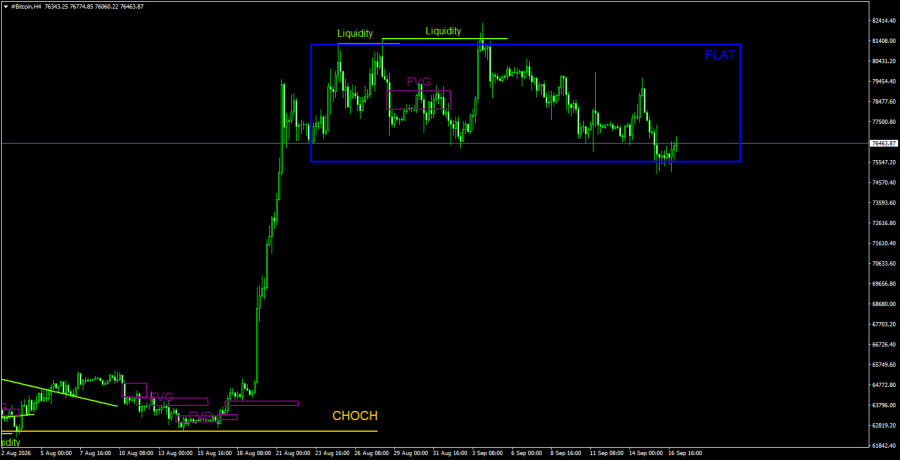
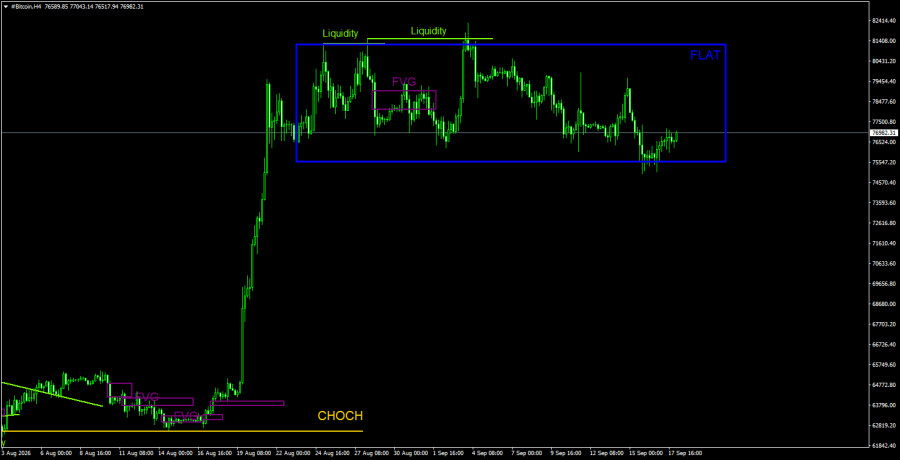
On the 4-hour timeframe, Bitcoin is also clearly flat. It twice removed sell-side liquidity, which led to a drop to the lower boundary of the channel as we forecast. A deviation formed near the lower boundary of the channel, which supports the expectation of a rebound back to the upper boundary. As long as price remains within the $75,600–81,200 channel, we advise traders to trade only from the channel boundaries. Internal patterns currently do not matter.
Trading Recommendations for BTC/USD
Bitcoin continues forming a downtrend despite the strong mid-August rally. We continue to expect a drop toward $57,500 (the 61.8% Fibonacci retracement of the three-year uptrend), although that level has effectively already been tested. We do not believe the downtrend has ended. The recent rise of the top cryptocurrency only weakly resembles a correction, and that is not a sufficient reason to open long positions. Liquidity may be taken from the $82,850 high, which could provoke a new leg down. On the 4-hour timeframe, a rebound may continue with targets at $78,400 and $81,200, since a deviation formed near the lower boundary of the sideways channel.
Explanations for the illustrations:
CHOCH – change of trend structure.
Liquidity – liquidity, Stop Losses, pending orders that market-makers use to accumulate positions.
FVG – Fair Value Gap. A price area of inefficiency. Price passes through these areas quickly, indicating the absence of one side in the market. Subsequently, price tends to return and react to such areas in continuation of the main trend.
IFVG – Inverted Fair Value Gap. After returning to such an area, price doesn't react; it impulsively breaks it and then tests it from the other side.
OB – Order block. The candle where a market-maker opened a position aiming to take liquidity to form their own position in the opposite direction.
Смотрите также