Trading Recommendations for Bitcoin (BTC) on September 22 Using the ICT System
Crypto-currencies
2026-09-22 04:11:36
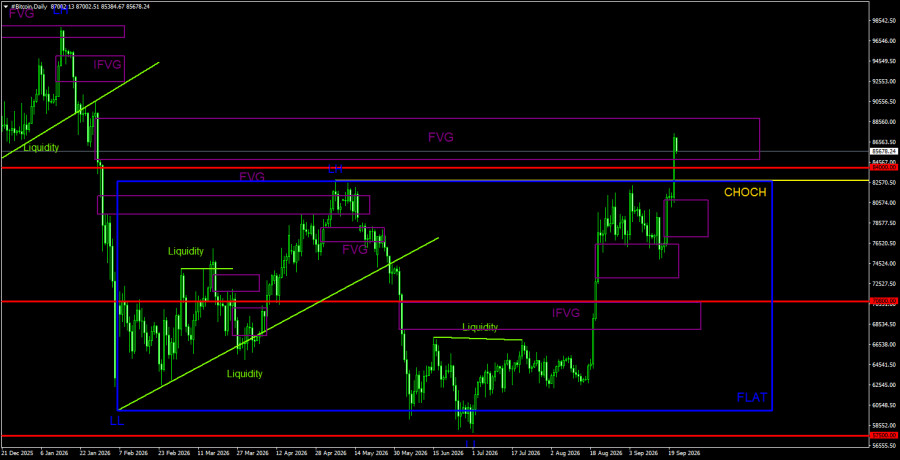
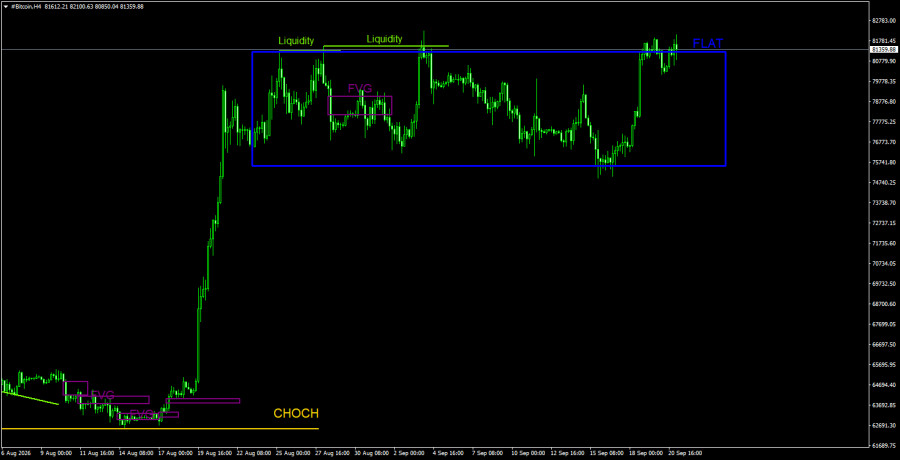
Bitcoin has broken out of its local flat and moved into open space. As we warned, a new leg up began essentially without advance notice and not based on any particular macro event — the market started buying "digital gold" again in the latest historical Bitcoin pump. The breakout was preceded only by two buy-side liquidity grabs on the 4-hour timeframe. We cautioned that after the lower boundary of the sideways channel was worked off a move toward the upper boundary should be expected. A deviation formed near the upper channel edge but was almost immediately invalidated as price closed above the channel, confirming the flat's end. The move also reacted to a nearby bullish FVG. On the daily timeframe, the bearish trend structure can be considered broken, since the CHOCH line was decisively overcome. In the short term, a correction is possible because a bearish FVG from the prior trend was just filled.
As soon as Bitcoin began to rise, commentators quickly returned to bullish forecasts and a variety of explanations. The most down-to-earth story is simple: inflows into exchange-traded Bitcoin instruments. If demand rises, price rises. But predicting when a particular whale or large fund will start a new wave of purchases is impossible. Fundamental factors point the other way: the Federal Reserve has started a tightening cycle, which is negative for risk assets, and the long-awaited Clarity Act failed again — both could have driven Bitcoin down by many thousands of dollars. Yet, as we warned, pumps do not require rational reasons. A pump is a form of market behavior — often manipulative — that resists analysis and precise forecasting.
We again emphasize that Bitcoin is not truly decentralized in the sense many imagine. Some assume that because central banks and governments cannot directly control Bitcoin, it is fully decentralized and independent. In reality, large investors can meaningfully influence the price. So calling Bitcoin's price purely a free-market outcome is incorrect. Analysts also noted a short-squeeze — mass stops liquidating short positions — but the specific trigger for Monday's sharp rise cannot be identified with confidence.
Overall BTC/USD Picture on 1D
On the daily timeframe, the bearish trend structure has been broken, so "digital gold" has most likely officially begun forming a new bullish trend. Price has just filled the bearish FVG from the prior downtrend, so a correction may begin. However, note that yesterday's Bitcoin rally — like the mid-August upswing — shows all the characteristics of a pump. A break outside the $60,000–82,500 sideways channel could itself be a deviation.
Overall BTC/USD Picture on 4H
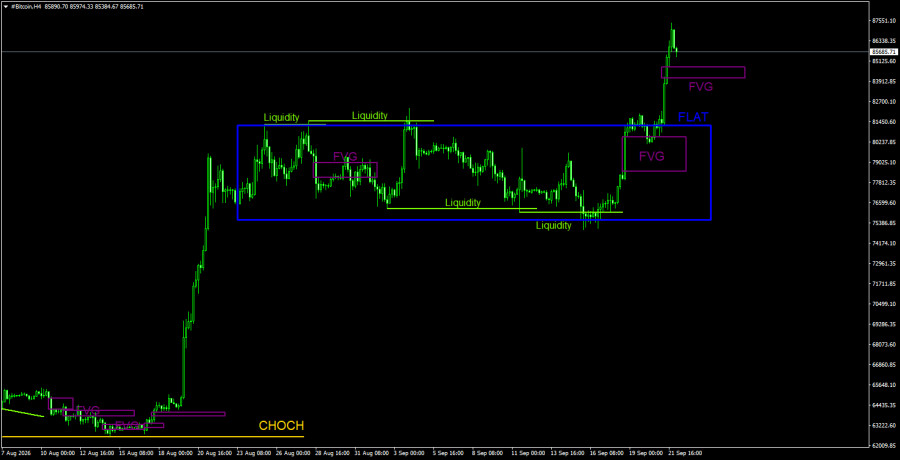
On the 4-hour timeframe, Bitcoin has left the boundaries of the sideways channel. Four deviations formed within that channel, the last two being bullish. Traders could have played the final move from the lower to the upper channel edge, and the flat can now be considered complete. The nearest area of interest is the last bullish FVG. With the flat finished, traders can focus on patterns again; on the daily timeframe, the picture is the opposite—Bitcoin may react to the prior bearish pattern.
Trading Recommendations for BTC/USD:
Bitcoin displays all the signs of a new bullish trend beginning. This trend often starts with a pump that lacks a clear rational cause. The Fed has not started cutting rates, and the CLARITY Act was not passed. In the near term, Bitcoin on the daily TF may react to the bearish FVG and undergo a downward correction. Also note that the current breakout beyond the sideways channel on the daily chart may be a deviation — perhaps a deep one, but a deviation nonetheless. On the 4-hour timeframe, one can locally consider long positions off the last bullish FVG. However, our preferred scenario at the moment is for a corrective pullback.
Explanations for the illustrations:
CHOCH – change of trend structure.
Liquidity – liquidity, Stop Losses, pending orders that market-makers use to accumulate positions.
FVG – Fair Value Gap. A price area of inefficiency. Price passes through these areas quickly, indicating the absence of one side in the market. Subsequently, price tends to return and react to such areas in continuation of the main trend.
IFVG – Inverted Fair Value Gap. After returning to such an area, price doesn't react; it impulsively breaks it and then tests it from the other side.
OB – Order block. The candle where a market-maker opened a position aiming to take liquidity to form their own position in the opposite direction.
Смотрите также